Cluster
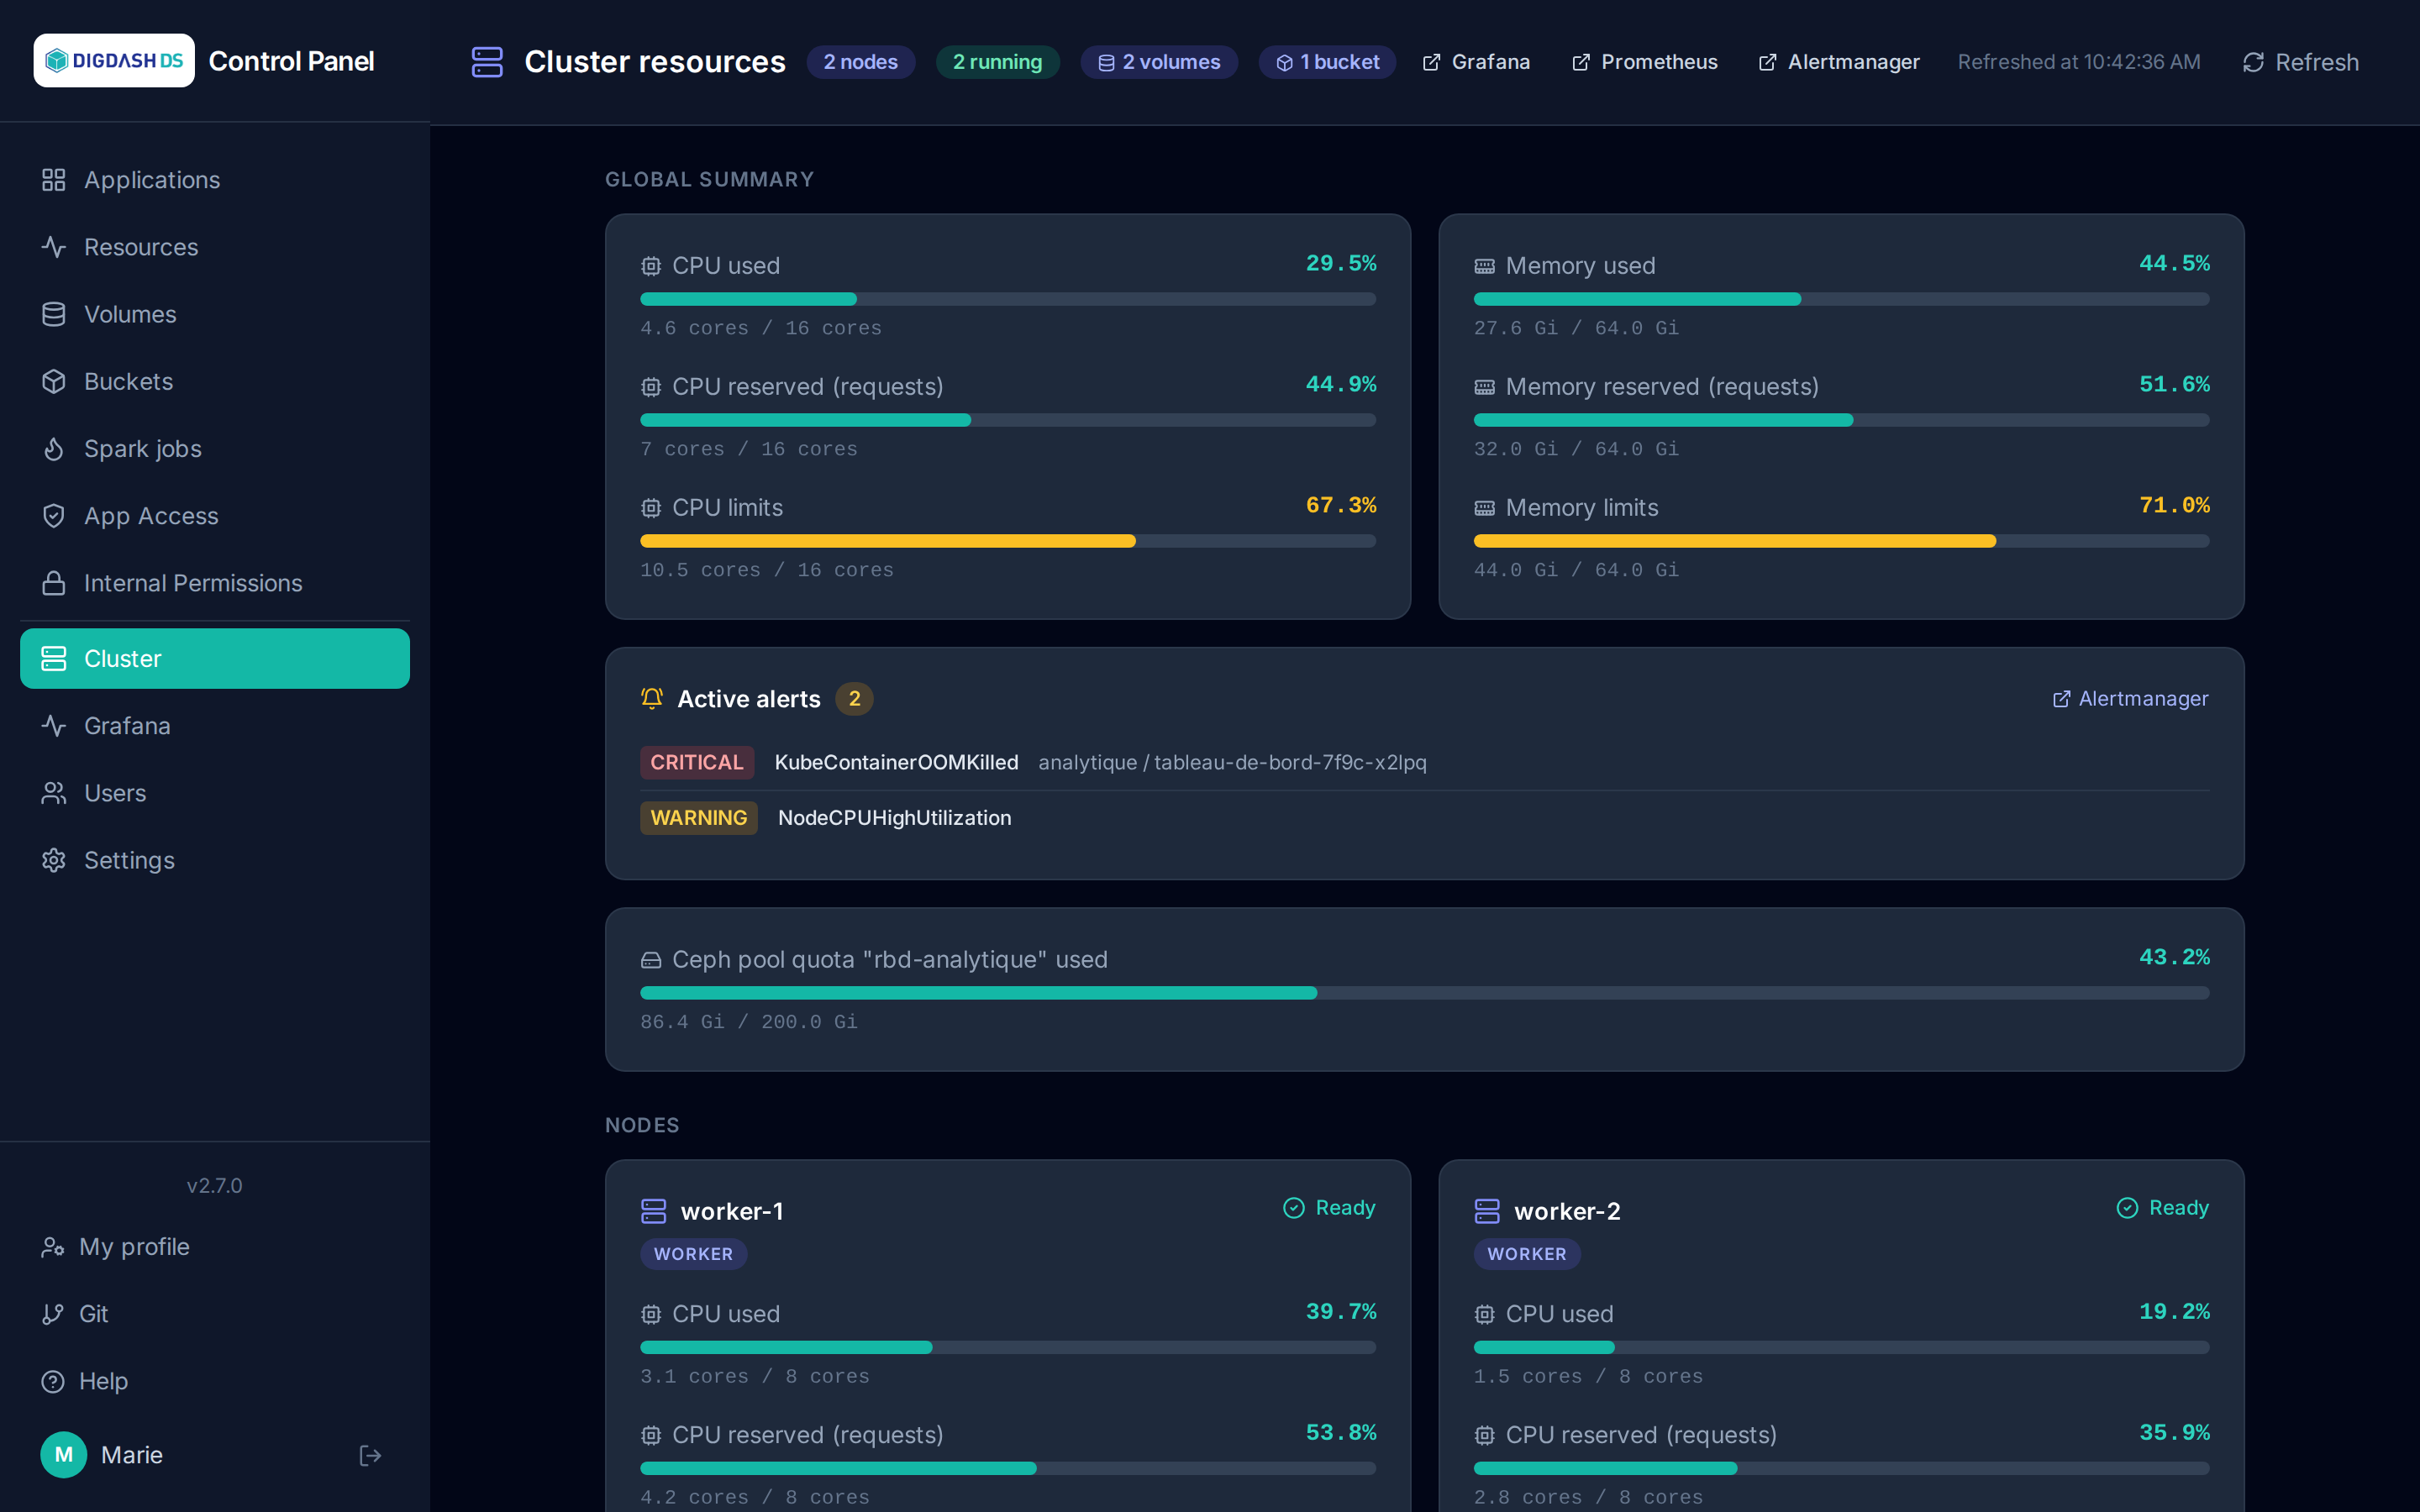
The Cluster page (restricted to platform administrators) gives a live, platform-wide overview of Kubernetes resources — across all namespaces. It refreshes automatically every 30 seconds, or immediately via Refresh.
The header shows four quick indicators: the node count, the number of running pods, and the platform-wide total of volumes and buckets, across all namespaces.
Global summary
Three indicators per resource (CPU and memory), measured against the cluster's total capacity:
| Indicator | Meaning |
|---|---|
| Used | Actual consumption, as measured by the metrics server |
| Reserved (requests) | Sum of the quantities requested by all pods — what Kubernetes guarantees |
| Limits | Sum of the configured caps — can exceed actual capacity (over-allocation), worth watching |
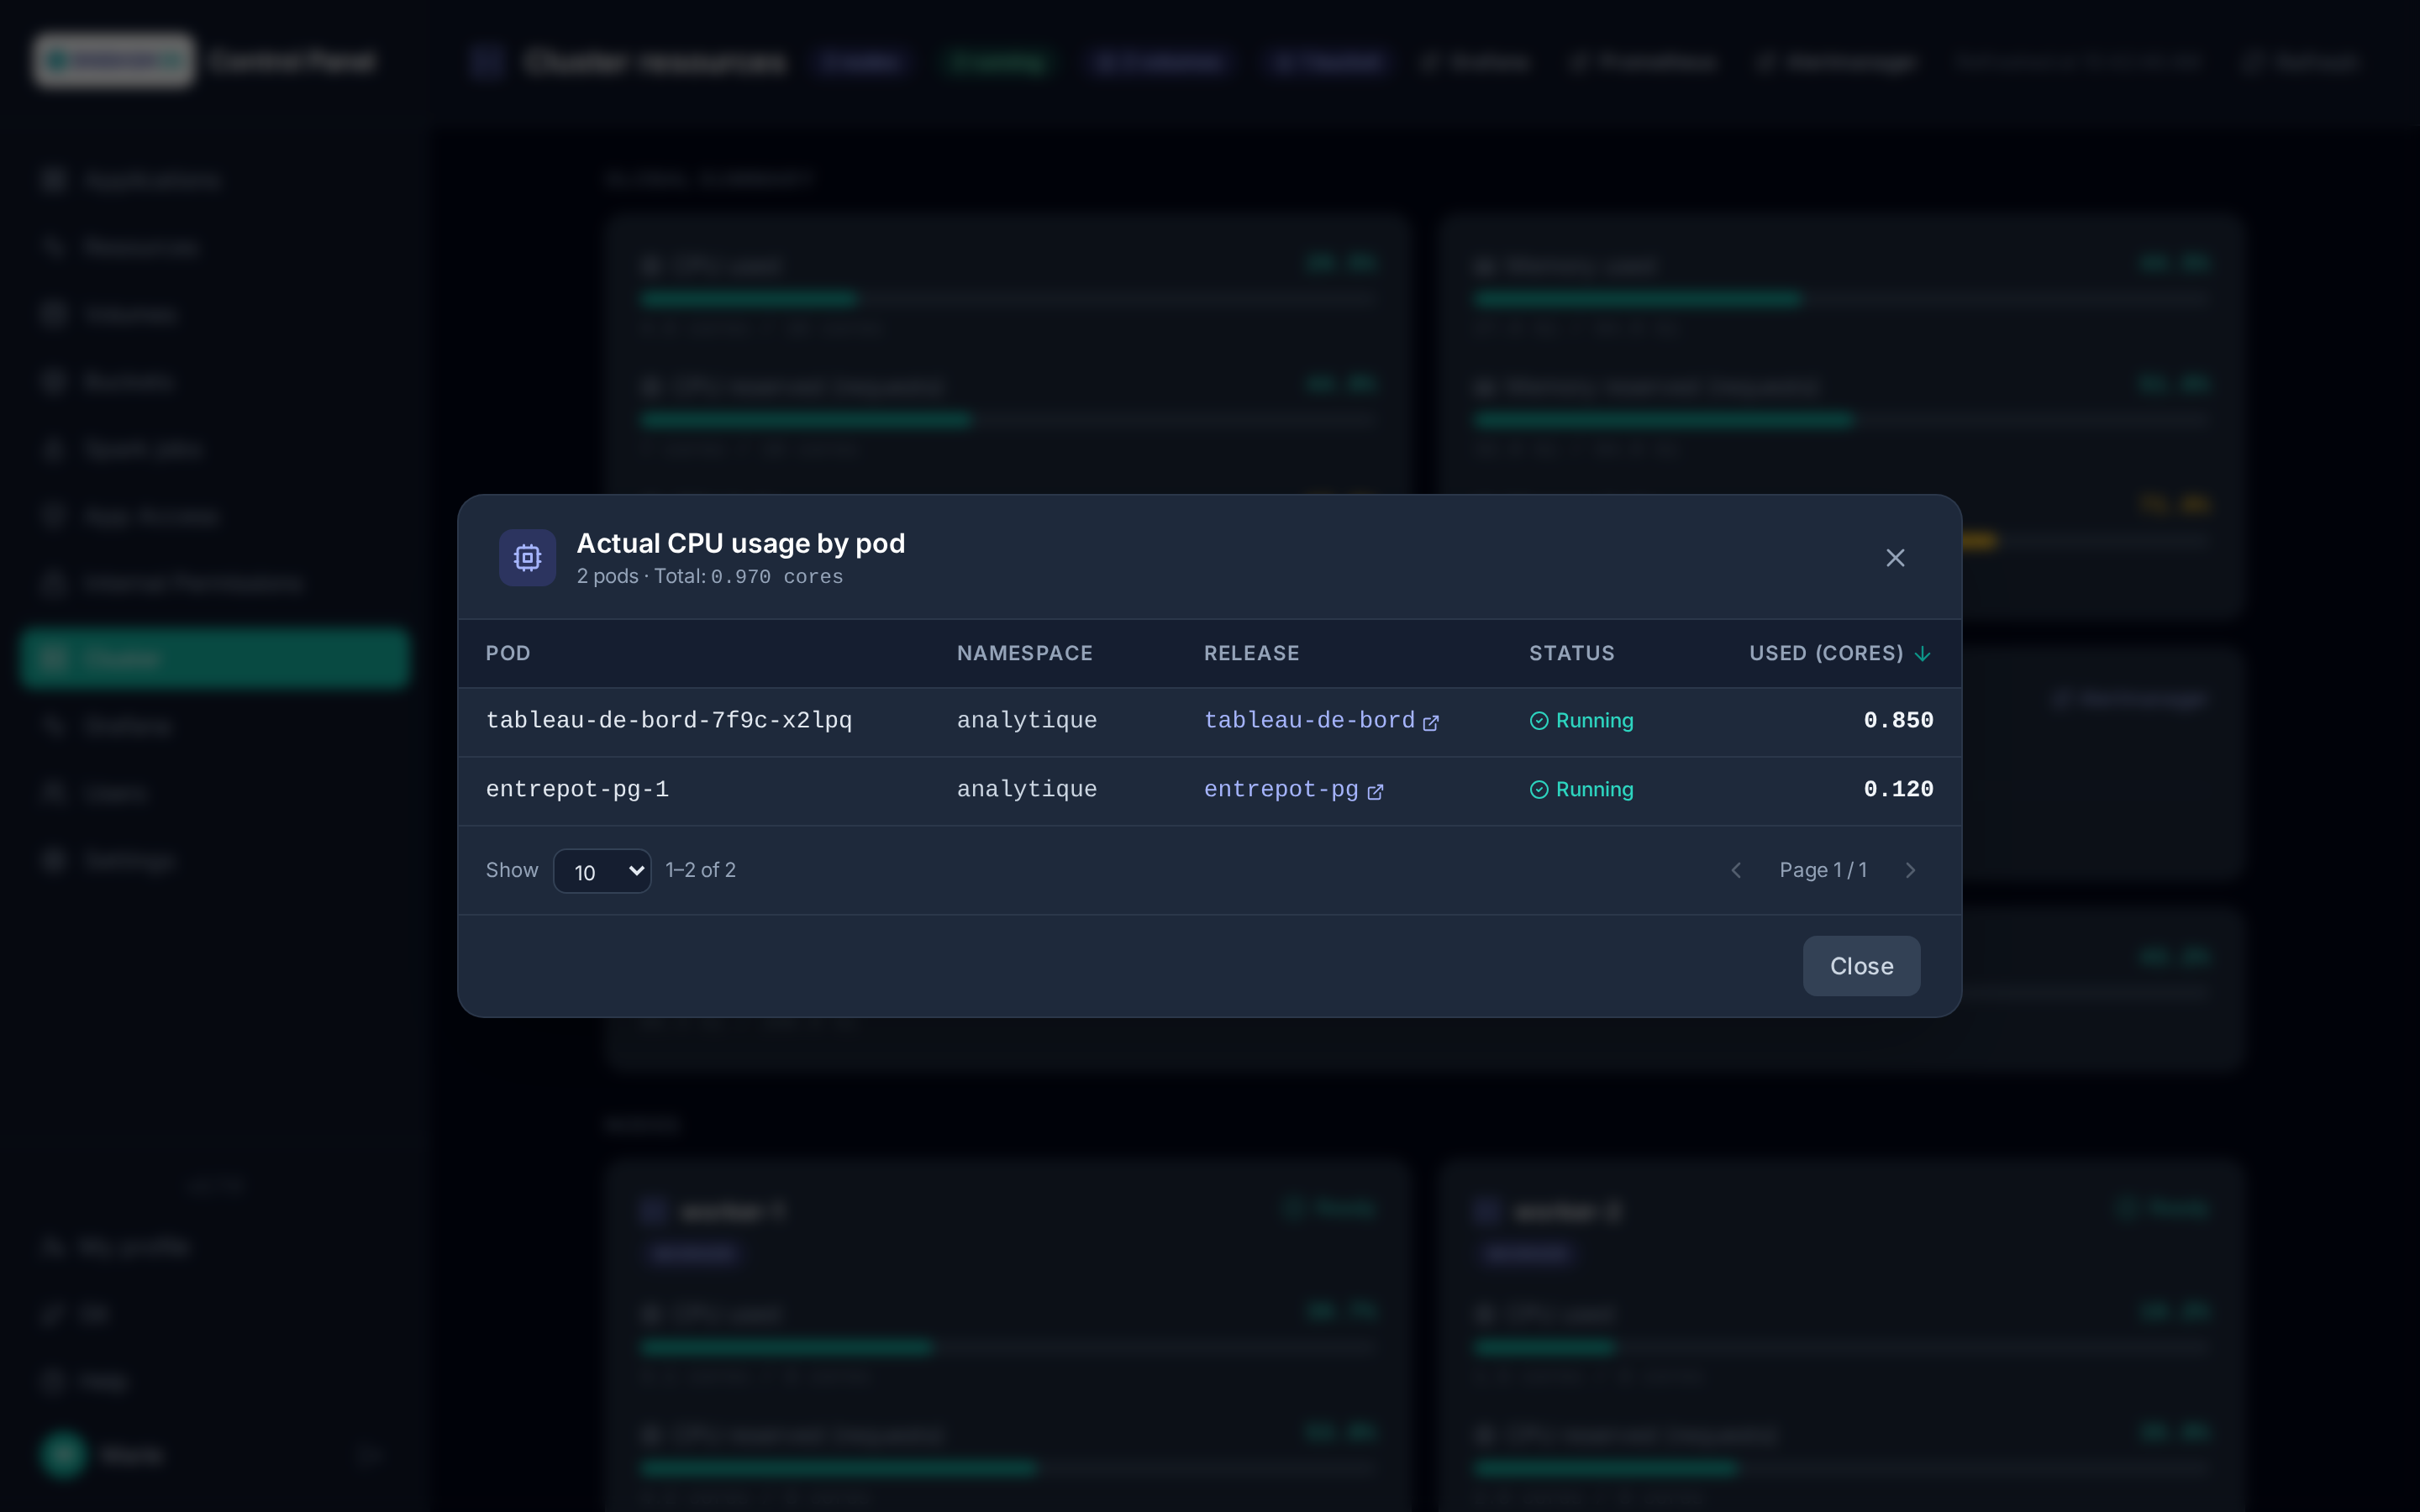
Clicking an indicator's label opens the breakdown by pod: the list of every pod in the cluster sorted by consumption, with a direct link to the corresponding application when the pod belongs to a release managed by the Control Panel.
Storage
A Ceph storage card completes the global summary when the information is available. Depending on what could be determined, it shows:
- the quota of the application Ceph RBD pool and its usage, if that pool has a quota set;
- otherwise, the pool's usage against the total capacity of the Ceph cluster, if the pool has no quota;
- as a last resort, the overall capacity of the Ceph cluster (Rook), if the application pool could not be determined.
The card is absent if none of this information is available (for example, if the ceph CLI is unreachable).
Monitoring
When the platform monitoring stack (Prometheus, Grafana, Alertmanager) is installed, the page header offers three external links, Grafana, Prometheus and Alertmanager (authenticated with the usual platform account), and an Active alerts card lists the Prometheus alerts currently firing, most severe first, with their namespace and the affected pod.
The same stack also feeds, elsewhere in the Control Panel:
- the Used column of the Volumes page;
- the Metrics link on application cards (Grafana dashboard of the pod or namespace) — see Applications;
- the n active alerts banner above a namespace dashboard;
- the Grafana link in the sidebar.
If Prometheus is unreachable from the Control Panel, the links stay visible but the card says so and the derived values (alerts, volume usage) are shown as unavailable (n/d). The public URLs (GRAFANA_URL, PROMETHEUS_PUBLIC_URL, ALERTMANAGER_URL) and the internal Prometheus address (PROMETHEUS_URL) can be overridden in Cluster settings.
Nodes
Each node in the cluster is shown with its status (Ready or not), its roles, and the same six gauges (CPU/memory × used/reserved/limits) measured against its own capacity — useful for spotting an unbalanced node before the Kubernetes scheduler struggles to place new pods on it.
Note
These gauges give a complete platform-wide view, including workloads that are not catalog applications (system components, other cluster services). For the resource detail of a single namespace, see the corresponding application card on the dashboard.