Applications
The dashboard lists the applications in the current namespace, one card per application.
The catalog
The New app button opens the catalog of available templates, by category:
| Category | Templates |
|---|---|
| Processing | Apache Hop (GUI), Apache Hop Server, Trino, Spark Connect, Apache NiFi |
| Storage | PostgreSQL |
| Visualization | Digdash BI |
| Governance | Apache Iceberg (Polaris catalog), OpenMetadata |
| Data science | JupyterHub, MLflow |
| DevOps | nginx (static site) |
The Apache Iceberg, Trino and JupyterHub templates combine into a lakehouse on the platform's S3 buckets — see Lakehouse.
Forgejo, a special case
The Forgejo Git server doesn't appear in this catalog: it's a platform-wide application (a single instance for the whole cluster), managed from Settings → Git — see Git.
Anatomy of a card
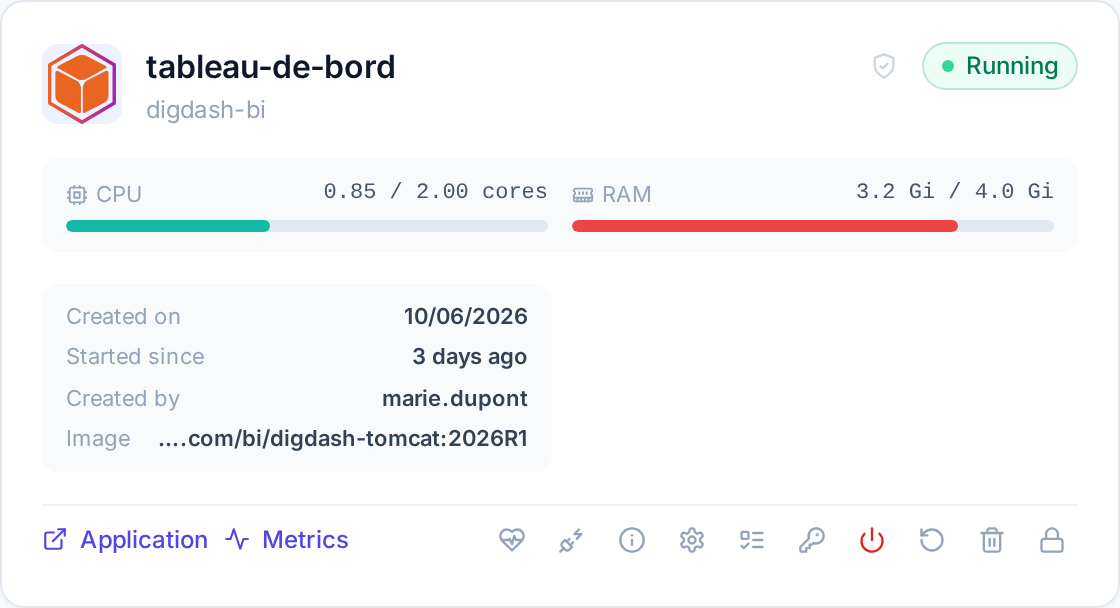
Each card shows:
- the name (or the display name if it has been customized), the template and the deployed image;
- the status:
Running,Pending(starting up),Stopped,Error; - the CPU and RAM gauges: actual consumption against the requested resources;
- the creation date and the author of the deployment.
Understanding the CPU and RAM gauges
Each gauge shows the pod's actual consumption (reported by the cluster's metrics server) measured against its limit if the application has one, otherwise against its requested quantity — see Configuring an application for the difference between the two.
0.85 / 2.00 cores: 0.85 core consumed out of a 2-core limit.3.2 Gi / 4.0 Gi: 3.2 GiB of RAM consumed out of a 4 GiB limit.n/a: the cluster's metrics server doesn't have a measurement for this pod yet (a recent restart, for example) — the gauge stays greyed out.
The bar's color indicates the consumption level against that ceiling:
| Color | Threshold | Meaning |
|---|---|---|
| 🟢 Teal | < 60% | Normal consumption |
| 🟠 Amber | 60% – 79% | Approaching the ceiling — worth watching |
| 🔴 Red | ≥ 80% | Near or at the ceiling — the application risks being throttled (CPU) or killed by the kernel (memory, OOMKill) |
In the screenshot above, CPU (42.5% of the limit) stays teal while RAM (80% of the limit) turns red — the signal to raise the application's memory limit from Configure.
Available actions
Depending on the template and the application's state:
| Action | Effect |
|---|---|
| Open (external link) | Access the deployed application in a new tab |
| Metrics (external link) | Open the application's Grafana dashboard (pod or namespace) — shown when the platform monitoring is installed, see Cluster |
| Stop / Start | Stop or restart the application without deleting it |
| Restart | Restart the pods (rollout) |
| Configure | Change the display name, resources, environment variables… — see Configure |
| View details | Pods, services, routes, internal connection information |
| Manage access | Authorize other users — see Access and permissions |
| Delete | Uninstall the release (confirmed by retyping the name, irreversible) |
Actions specific to certain templates
- API compatibility test (Digdash BI, Apache Hop Server, Forgejo): checks end-to-end that the application's API responds, with a detailed result per checkpoint (Healthy or Degraded badge).
- Resync Hop connections (Apache Hop GUI): immediately regenerates the Hop project's metadata files (connections to PostgreSQL databases, to Hop servers and to the namespace's buckets), without waiting for the periodic sync.
- Resync DigDash connections (Digdash BI): reprovisions the internal Audit / Comments / Form connections to the embedded PostgreSQL.
- Hop Jobs (Apache Hop Server): monitoring and launching of scheduled pipelines and workflows — see Apache Hop Server: jobs and scheduling for details.